How religion has changed in England and Wales
The landscape of religion1 in England and Wales is changing. The decade 2001 to 2011 saw a fall in the number of people identifying as Christian, and an increase in those identifying with minority religious groups and those reporting no religion.
There were 4 million fewer Christians in 2011 than 2001
More than 33 million people identified as Christian in 2011, and this was 59% of the population at this time. However, the number of people identifying as Christian has declined since 2001, when there were around 37 million Christians, representing 72% of the population.
The 2nd largest religious group were Muslims. The number of people identifying as Muslim increased from 1.5 million (3%) in 2001 to 2.7 million people (4.8%) in 2011. All other religious groups also saw an increase between 2001 and 2011.
A quarter of the population, more than 14 million people, said they had no religion in 2011. This was an increase of over 6 million people since 2001 when 15% of the population reported no religion.

Download the data.
Christians had the oldest age profile of all religions
Over 1 in 5 (22%) Christians were aged 65 and over, compared with 16% of the total population. Muslims had the youngest age profile with nearly half (48%) aged under 25 and 88% aged under 50.
Over 9 in 10 (93%) Christians and people with no religion were from a White ethnic background. Muslims were more ethnically diverse, with two-thirds (68%) from an Asian background including Pakistani (38%) and Bangladeshi (15%). The majority of Hindus and Sikhs were also from an Asian background (96% and 87% respectively).
The highest proportions of Christians were in the north of England
Fewer than half (48.4%) of the population of London were Christian, compared to more than two-thirds in the North East (67.5%) and North West (67.3%). London was the most diverse region with the highest proportions of people identifying as Muslim, Jewish, Buddhist and Hindu.
Around 8 in 10 people (80.9%) in Knowsley were Christian, and Christianity remained the largest religion in all local authorities except Tower Hamlets, where there were a higher proportion of Muslims (34.5%) than Christians (27.1%). Norwich had the highest proportion of people reporting no religion with 42.5%, closely followed by Brighton and Hove with 42.4%.
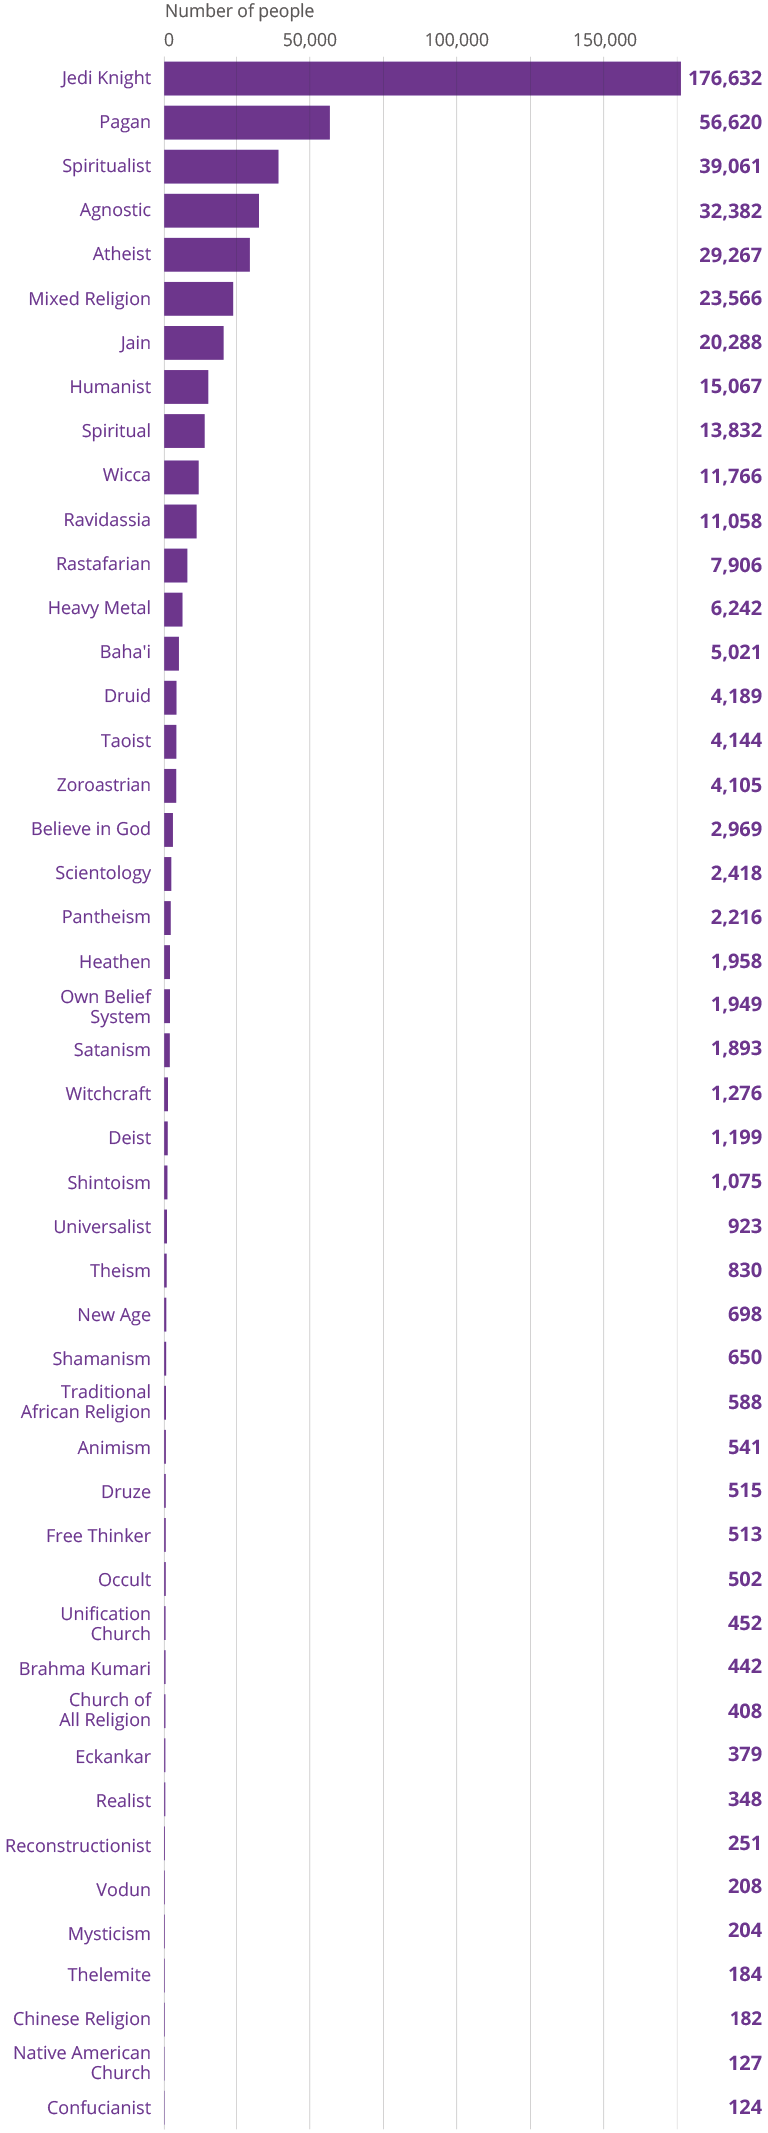
Other religious identities in the census: nearly 177,000 people identified as Jedi
The Census allows people to write in their religious identity if they do not identify with the main categories included on the census form. Analysis of written responses to the ‘other religion’ option revealed that nearly 177,000 people identified as ‘Jedi’ in 2011, although this was less than half the 2001 figure (390,000 people). The other most common written responses included ‘Pagan’ (57,000) and ‘Spiritualist’ (39,000).

Download the data
Visit the 2011 Census Analysis website for more information on what the 2011 Census told us about England and Wales, or contact census.customerservices@ons.gov.uk.
Related
- Census 2011 analysis website Information and data on a range of census topics
- Statistical report Religion in England and Wales in 2011
- Statistical report What does the Census tell us about religion in 2011?
- Report Muslim Council of Britain report using Census data