Five facts about…older people at work
We’re living longer and we’re working for longer too. To mark the International Day of the Older Person (today), we have five facts which show the impact of those aged 65 and over on the UK workplace:
1. The proportion of those aged 65 and over who work has almost doubled since records were first collected
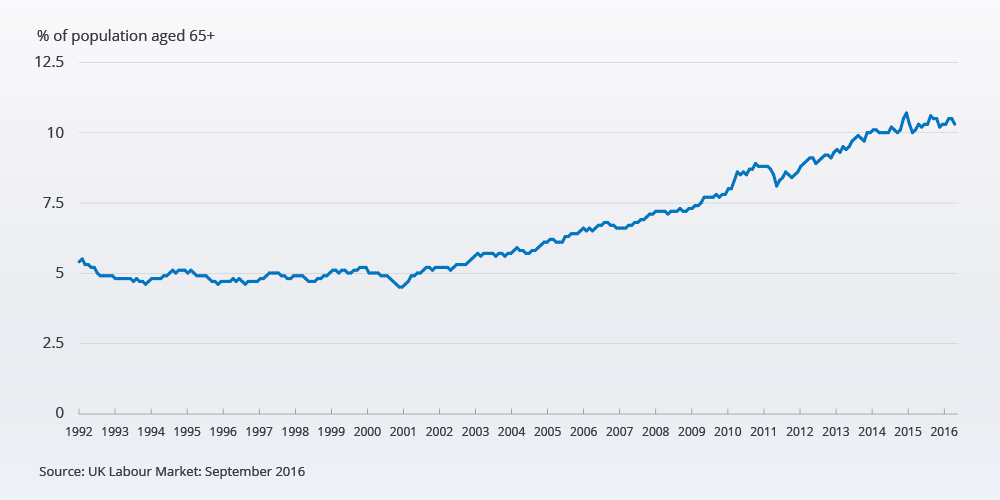
There were 10.4% (1.19 million) aged 65 and over in employment in the period for May to July 2016. In the same period for 2006, 6.6% (609,000) of the 65+ population had a job.
In March to May 1992 (when records first began), just 5.5% (478,000) were in employment.
Employment rate for people in the UK aged 65+, March to May 1992 to May to July 2016
Download the data.
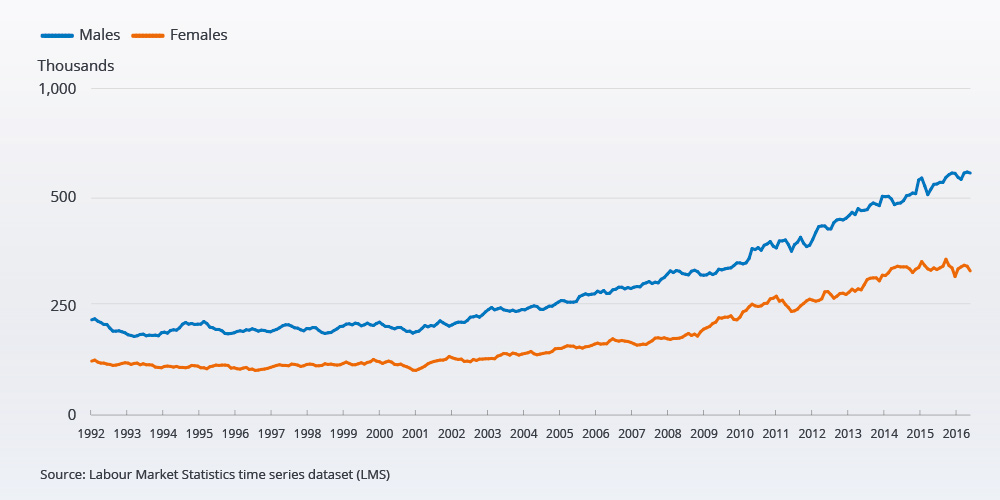
2. There were 742,000 men and 448,000 women aged 65 and over in employment in the UK in May to July 2016
This compares with 301,000 men aged 65 and over in employment for March to May 1992 (when records first began) and 177,000 women during the same period, according to the Labour Force Survey.
A possible factor contributing to the rise in employment among people aged 65 and over could be legislation which stopped employers from compulsorily retiring workers once they reached 65. This came into force in October 2011.
Number of males and females aged 65 and over in employment in the UK, March to May 1992 to May to July 2016
Download the data.
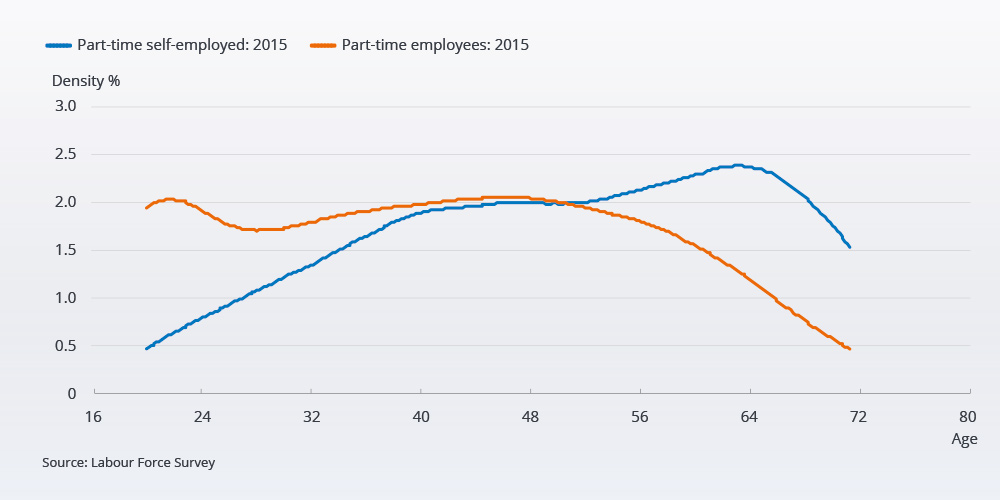
3. Part-time self-employed workers tend to be older than part-time employees
The 65 and over age group accounted for 22% of all part-time self-employment in 2015, up from 14% in 2001.
Almost half of those aged over 70 in employment were self-employed, in 2015 (49.13%). In 2001 it was nearer a third (39.68%).
Age distribution of part-time employees and the part-time self-employed, 2001 and 2015
Download the data.
4. The economy may come to rely increasingly on older workers by 2039
Under exisiting legislation, the number of people of State Pension Age (SPA) and over is projected to increase by 32.5% from 12.4 million in mid-2015 to 16.5 million by mid-2039.
This reflects the higher number of people who were born in the 1960s ‘baby boom’ reaching State Pension Age within the 25 year period to mid-2039.
Over the same period, the number of people of working age (age 16 to SPA) is projected to rise by 10.3% from 40.4 million in mid-2015 to 44.6 million by mid-2039.
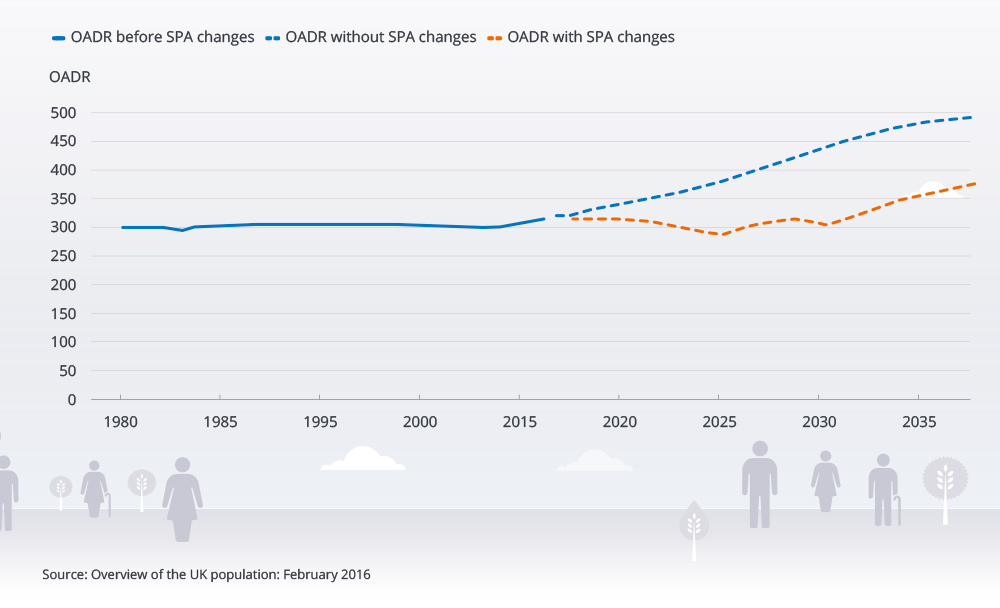
The number of people of pensionable age for every thousand people of working age (the Old Age Dependency Ratio) was steady at around 300 from the 1980s to 2006, but rose in 2007-09 as women born in the post-World War II baby boom reached SPA.
In the absence of any increases to SPA, it would reach 487 by 2039; but, as a result of planned SPA increases taking place between 2010 and 2046 under current legislation, it is expected that – for every 1,000 people of working age in 2039 – there will be 370 people of SPA.
The increase in the OADR means there will be fewer people of working age to support a larger population over SPA.
Old age dependency ratio (OADR), UK, 1980 to 2039
Download the data.
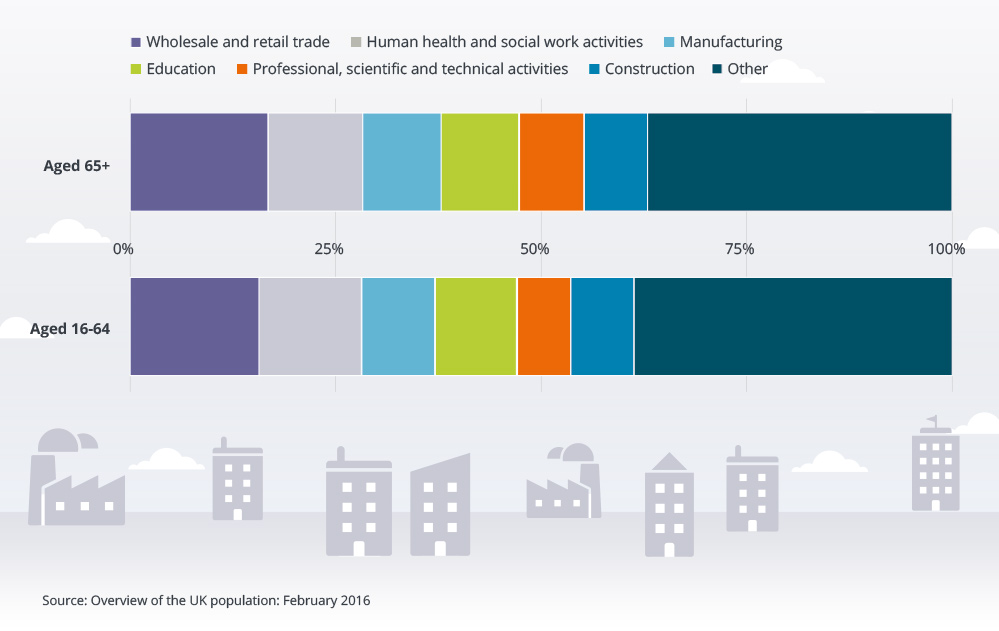
5. The working world for people aged 65 and over is similar to those aged 16 to 64
Six industries are responsible for just over 60% of the employment of both age groups.
Percentage of those aged 16 to 64 and 65 and over in work, by industry, UK, 2011 Census
For more information, please contact: digital.content@ons.gsi.gov.uk
If you like our visual.ONS content and would like to see more, please sign up to our email alerts, selecting ‘stories and infographics’ under preferences.
More in the ‘Five facts about…’ series:
Five facts about …housing
Five facts about…strikes
Five facts about…cars
Five facts about…the service sector
Related
- 2011 Census analysis: Workers aged 65 and Over in the 2011 Census Article
- LFS: In Employment: UK: Male: Aged 65+: Thousands: SA Time series
- Employment level 65 + Women Time series
- Employment rate 65 + People Time series
- Trends in self-employment in the UK: 2001 to 2015 Article