Are house prices rising in all areas of the UK?
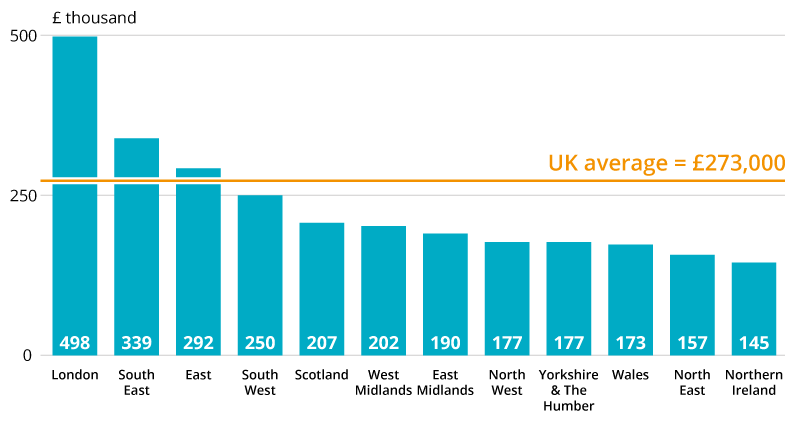
The latest HPI (House Price Index) in the UK reveals that house prices have gone up 9.6% over the past year. However, there is wide variation among regions in the average price of houses and the rate of change.
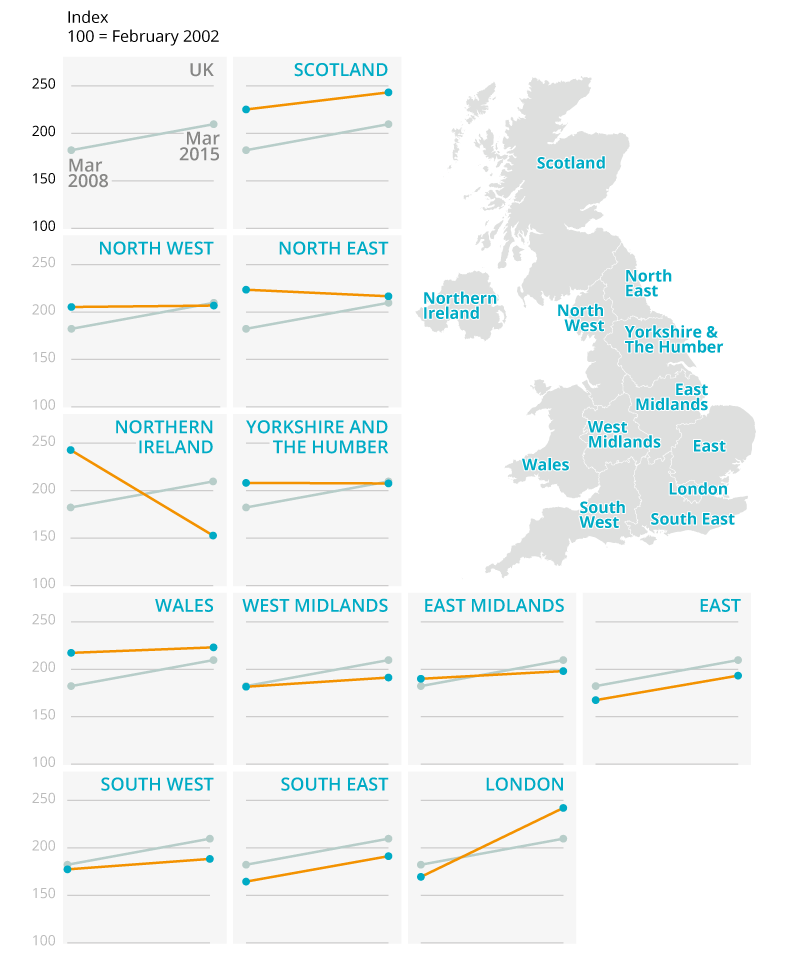
The data shows a clear North-South divide, with house prices becoming increasing high in London and the South since 2008, but remaining fairly flat in the North or even falling such as in Northern Ireland.
Large regional variations in average house prices
Average House Price by Region, March 2015
HPI house prices are mix-adjusted which means that different types of property are taken into account to ensure that figures are comparable across areas with different housing stock - and comparable over time.
Rate of change is also very different across the UK
The ‘small multiple‘ graphs below reveal a fascinating picture of house price change in the UK over time. Between 2008 and 2015, we can see that London’s index value has accelerated away from the rest of the UK. In contrast, Northern Ireland has moved in the opposite direction. We can see the North-South divide, with very minimal change in regions such as the North West, North East and Yorkshire and the Humber.
Index numbers are used to measure changes and simplify comparisons. They use a base year (in this case, 2002) and compare current data against it.
Regional change, March 2008 – March 2015
For more information, please contact: hpi@ons.gov.uk
Related
- House Price Index Statistical Release
- Average house prices: how expensive is your area? Interactive
- House price Monopoly: how do prices vary? Infographic
- Housing and home ownership in the UK Article

