Transition from a manufacturing to service led labour market over past 170 years
The 2011 Census gave a unique perspective on the changing labour market in England and Wales. Over the past century, we’ve seen a dramatic change from a manufacturing led economy to a service led economy. Even the past decade has seen substantial change in the labour market structure.
80% of workers were in the service industry in 2011
Composition of the labour force, England and Wales, 1841 to 2011
The nature of the labour market has changed considerably over the last 170 years. In 1841 most people worked in manufacturing, but by 1881 those working in services overtook manufacturing. From 1961 the gap between services and manufacturing widened at its fastest rate, and by 2011 80% of workers were in the service industry and 10% in manufacturing.
In 1841, 20% of workers were in agriculture and fishing but this number has declined at every census since. In 2011, less than 1% worked in agriculture and fishing.
Self employment and home working highest in rural areas in 2011
Percentage of self employed and home workers, England and Wales, 2011
Source: 2011 Census Analysis, Office for National Statistics
Self-employment was at its highest level in 40 years at the time of the 2011 Census although there was significant variation across local authorities. Self-employment accounted for a third (33.2%) of all workers in the Isles of Scilly but less than 1 in 10 (8.7%) workers in Corby.
As with self-employment, the number of home workers is at its highest level and is most prevalent in West Somerset where more than 1 in 4 (25.7%) people in employment were home workers in 2011. This contrasts with Kingston upon Hull where only around 1 in 20 (5.2%) were home workers.
1 in 10 people who were retired in 2001 had returned to work in 2011
Employment amongst the older population is an important issue, particularly with regard to ongoing changes to the state pension age. The workforce of people aged 65 and over is large, almost a million people in 2011. For those aged 65 to 74, 1 in 10 people who were retired in 2001 had returned to work in 2011.
Over half the working population drove to work but less than 1 in 10 carried a passenger
Method of travel to work, England and Wales, 2011
In 2011, more than half of the working population of England and Wales (57.5%, 15.3 million people) usually drove to work in a car or van. For the most part, the drivers were the sole occupants of these vehicles with less than 1 in 10 carrying a commuting passenger.
Methods of travel to work vary depending on factors such as distance, time of day and local infrastructure. There are large differences in methods of travel to work between urban and rural areas. For example, the local authorities with the largest proportions of people using public transport were all in London, with two-thirds of people in Newham and Lambeth commuting by public transport.
Capital leads the way with number of people cycling to work doubling since 2001
Percentage change from 2001 in the number of people cycling to work, England and Wales, 2011
The number of people cycling to work aged 16 to 74 in England and Wales has increased by 14% from 651,000 in 2001 to 741,000 in 2011. However, this still represents only around 1 in 35 (2.8%) of all workers. In London as a whole, the number of people commuting to work by bike doubled from 77,000 to 155,000. However several regions saw fewer people cycling to work. There were also substantial increases in the number of people cycling to work in many other major cities.
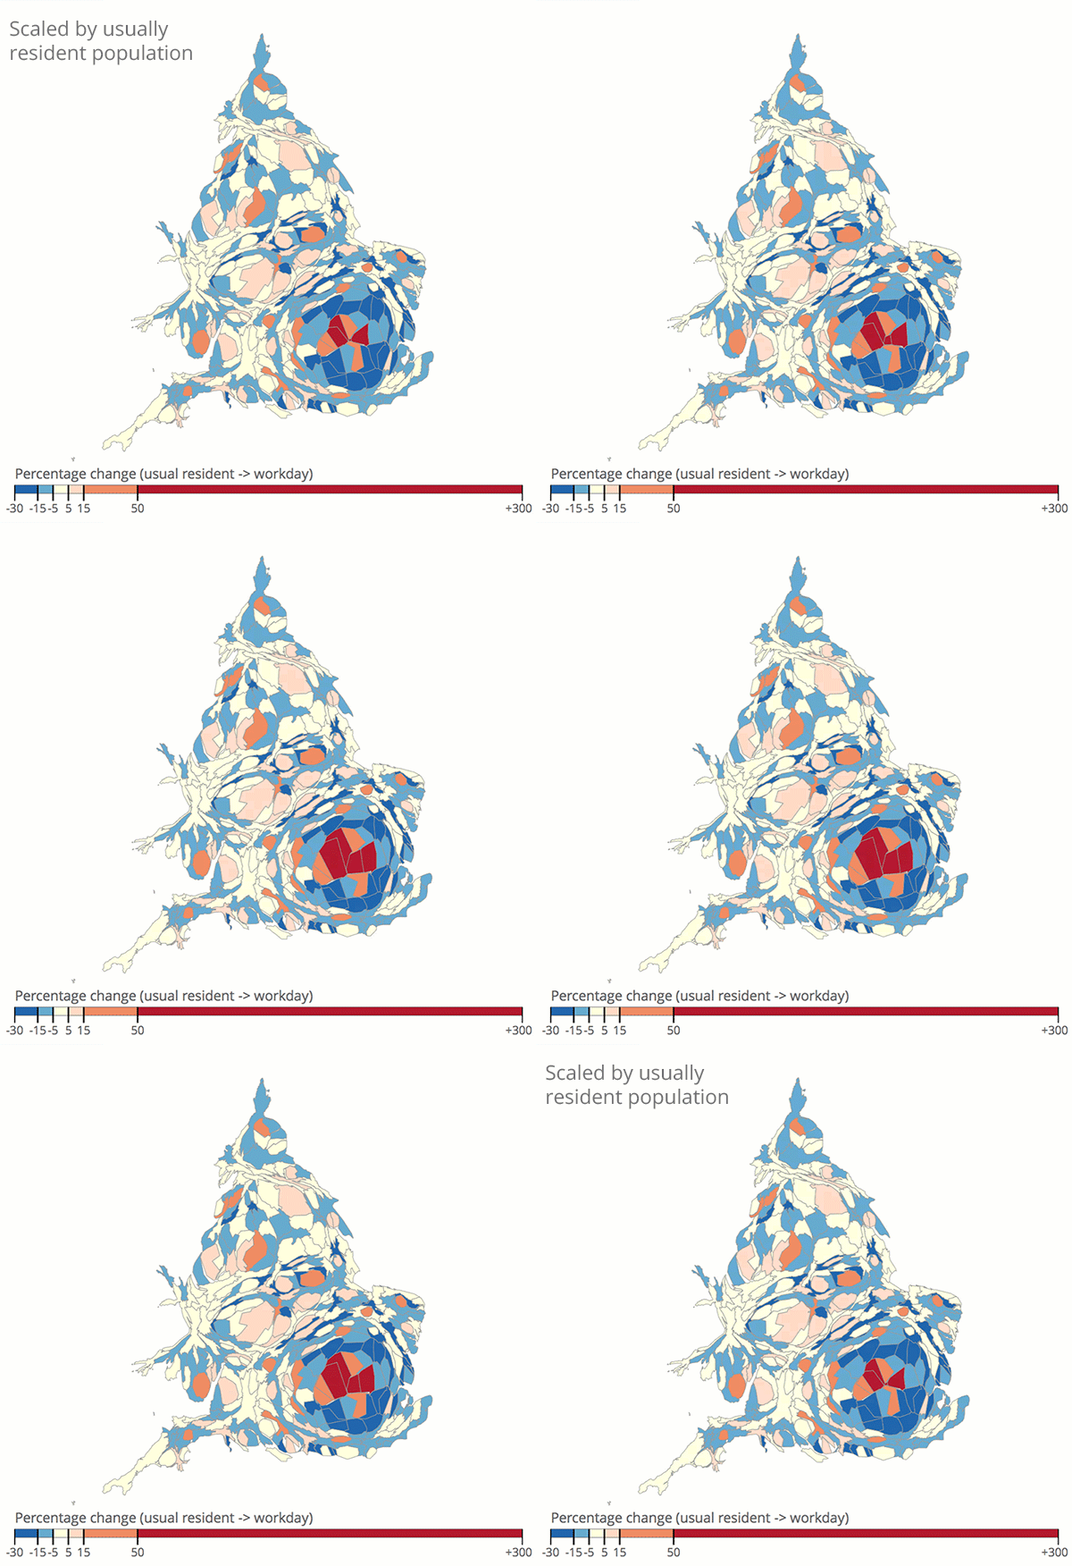
Workday population of City of London 56x greater than usual resident population

Source: 2011 Census Analysis, Office for National Statistics
Where people work can cause substantial changes in the local population during the working day. For example, the workday population of the City of London is 56 times greater (358,000) than its usually resident population of 6,000. At the other end of the scale, Lewisham saw a 28% fall from 206,000 to 149,000, reflecting the large number of people who commute out of the local area for work.
Visit the 2011 Census Analysis website for more information on what the 2011 Census told us about England and Wales, or contact census.customerservices@ons.gov.uk.
Related
- Census 2011 analysis website Information and data on a range of census topics
- Statistical report Historical census analysis of changes in industry composition
- Statistical report Census analysis of workers aged 65 and over
- Statistical report Census analysis of methods of travel to work
- Statistical report Analysis of population changes during the working day